Barnsley's fern
25 Apr 2019Ok, I’ve never suspected I would love this so much ahah ! But once you enter the world of fractals… you’ll always want more.
My first playground is a fractal that looks like a leaf. Not any leaf, a fern leaf. This comes from Michael Barnsley work upon fractals. It demonstrate an example of an iterated function system. A fractal is the union of several copies of a geometric model, each being transformed by a function. Usually represented on 3 dimensions, they are often computed and drawn in 2D. The canonical example is the Sierpiński triangle.
Barnsley’s fern uses 4 affine transformations.
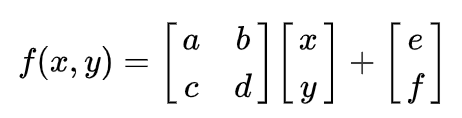
| w | a | b | c | d | e | f | p | Portion generated |
| ƒ1 | 0 | 0 | 0 | 0.16 | 0 | 0 | 0.01 | Stem |
| ƒ2 | 0.85 | 0.04 | −0.04 | 0.85 | 0 | 1.60 | 0.85 | Successively smaller leaflets |
| ƒ3 | 0.20 | −0.26 | 0.23 | 0.22 | 0 | 1.60 | 0.07 | Largest left-hand leaflet |
| ƒ4 | −0.15 | 0.28 | 0.26 | 0.24 | 0 | 0.44 | 0.07 | Largest right-hand leaflet |
This table up here is not immutable, try to tweek it’s values and see what happens :)
Anyway, to begin with, I need to draw. and to draw I can use a canvas.
<!doctype html>
<html>
    <head>
        <meta charset="utf-8">
        <meta name="description" content="Barnsley's fern">
        <meta name="viewport" content="width=device-width, initial-scale=1">
        <title>Barnsley's fern</title>
    </head>
    <body>
        <canvas id="fern" width="600" height="600"></canvas>
    </body>
</html>
Now, I need to write a bit of javascript code. First, in a script tag, while getting the canvas element, I define the context as a 2D one, we won’t deal with 3D today. And I grab it’s dimensions.
<script type="text/javascript">
    const canvas = document.getElementById('fern');
    const canvasWidth = canvas.width;
    const canvasHeight = canvas.height;
    const ctx = canvas.getContext("2d");
</script>
Let define the starting points and position.
    // ...

    let pointX = 0;
    let pointY = 0;
    let x = 0;
    let y = 0;
For a defined serie, I’ll draw a point, a dot, and between each iteration, I’ll copy it’s values, then transform it according to the function and the given values in the table up above. Let’s say I’ll draw 150’000 dots.
    // ...
    let c = 0

    while (++c < 150000) {
        drawPoint();
        nextPoint();
    }
Let’s code the drawPoint function. I’ll use the fillRect method to depict and draw the point in the canvas.
    // ...

    function drawPoint () {
        ctx.fillRect(px,py,1,1);
    }
Let’s see the nextPoint method. This is the method that will implement the maths. This is the method you’ll want to tweak.
    function nextPoint() {
        let r = Math.random();
        if ( r < 0.01) {
            pointX =  0;
            pointY =  0.16 * y;
        } else if ( r < 0.86) {
            pointX =  0.85 * x +  0.04 * y;
            pointY = -0.04 * x +  0.85 * y + 1.6;
        } else if ( r < 0.93) {
            pointX =  0.20 * x + -0.26 * y;
            pointY =  0.23 * x +  0.22 * y + 1.6;
        } else {
            pointX = -0.15 * x +  0.28 * y;
            pointY =  0.26 * x +  0.24 * y + 0.44;
        }

        x = pointX;
        y = pointY;
    }
We could be done. But unfortunately, I need to make my point to be visible and proportionnaly dispatch within my canvas. If I stop here, I won’t see anything but disappointment. To map the point with the canvas I’ll create a map method. And because I don’t care I’ll use a prototype x) and update the draw function accordingly.
    // ...

    Number.prototype.map = function (in_min, in_max, out_min, out_max) {
      return (this - in_min) * (out_max - out_min) / (in_max - in_min) + out_min;
    }

    function drawPoint () {
        let px = x.map(-2.1820, 2.6558, 0, canvasWidth);
        let py = y.map(0, 9.9983, canvasHeight, 0);

        ctx.fillRect(px,py,1,1);
    }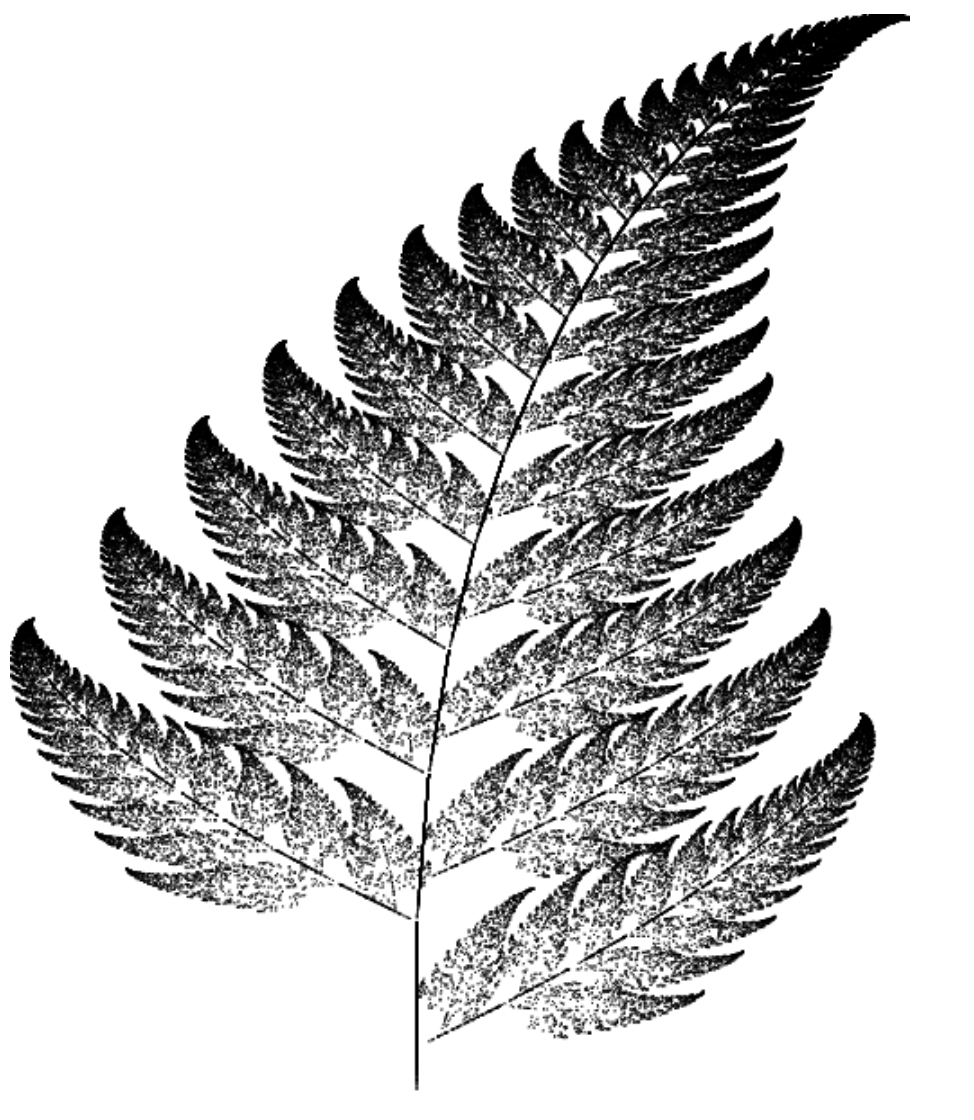
Isn’t that cool ?? ahah :D Try some mutations and see what happens :)
The code is available here.