Lissajous curve table
26 Apr 2019This time it’s not a fractal. Let say, you’ve got a pendulum full of sand. You set a movement, kind of a rotation. At first the sand will draw an ellipse. With the rotation speed decreasing, the ellipse become an circle. After a while, it’s an ellipse again, and then a circle again, but not in the same direction.
That combination of speed, rotation and angle is the key. Lissajous curve table is the demonstration.
Let start as the previous one with an html file, and a canvas.
<!doctype html>
<html>
    <head>
        <meta charset="utf-8">
        <meta name="description" content="Lissajous curve table">
        <meta name="viewport" content="width=device-width, initial-scale=1">
        <title>Lissajous curve table</title>
        <style type="text/css">
            body { background-color: black; }
        </style>
    </head>
    <body>
        <canvas id="lissajous" width="800" height="800"></canvas>
    </body>
</html>
Let’s grab the canvas and it’s dimension, we’ll use the 2D context here. And we add some configuration.
<script type="text/javascript">
const canvas = document.getElementById('lissajous');
const canvasWidth = canvas.width;
const canvasHeight = canvas.height;
const ctx = canvas.getContext("2d");
// Every line will be drawn in white.
ctx.strokeStyle = '#ffffff';
ctx.fillStyle = '#ffffff';
let angle = 0.0; // default angle
let diameter = 80; // circle diameter
let cols = canvasWidth / diameter - 1; // number of columns through the available space
let rows = canvasHeight / diameter - 1; // number of rows through the available space
let r = diameter / 2; // radius size
let curves = [[]]; // keeping track of each curve to draw.
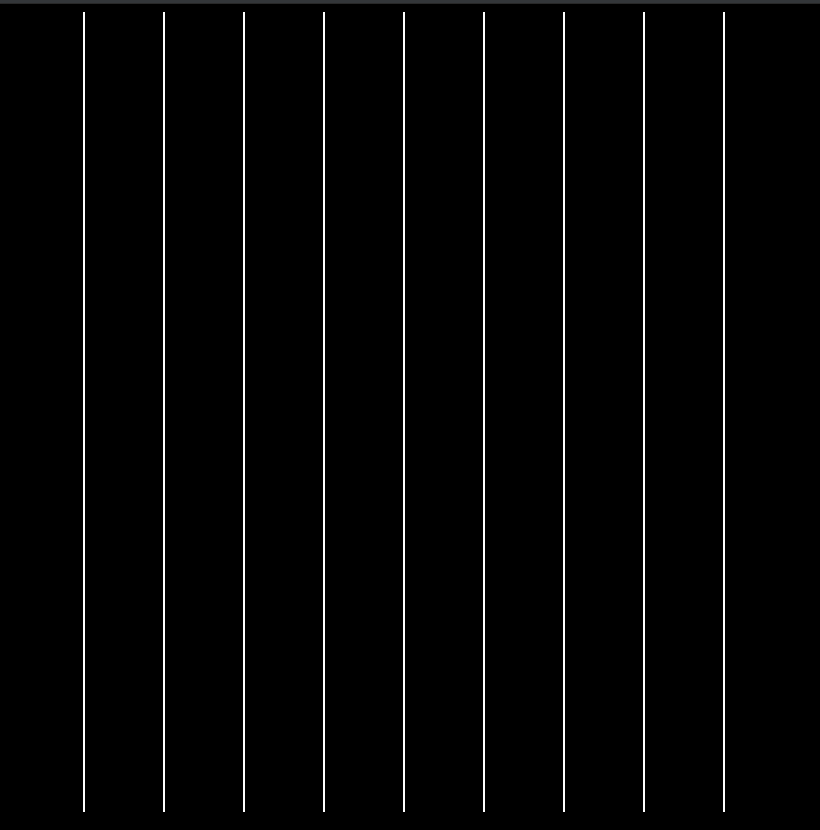
</script>We are going to draw/update everything every 33ms, which is about 30 images / second. Let’s start with the columns.
    // ...

    setInterval(() => {
        ctx.clearRect(0,0,canvasWidth,canvasHeight);

        drawCols();
    }, 33);
// ...
function drawCols () {
for (let i=0; i<cols; i++) {
let cx = diameter+diameter*i; // here, I let a breathing space on the left, then space each line by the diameter
ctx.beginPath();
ctx.moveTo(cx, 0);
ctx.lineTo(cx, canvasHeight);
ctx.stroke();
}
}
Now the rows.
    // ...

    function drawRows () {
        for (l  et j=0; j<rows; j++) {
            let cy = diameter+diameter*i; // here, I let a breathing space on the left, then space each line by the diameter

            ctx.beginPath();
            ctx.moveTo(0, cy);
            ctx.lineTo(canvasWidth, cy);
            ctx.stroke();
        }
    }

    setInterval(() => {
        ctx.clearRect(0,0,canvasWidth,canvasHeight);

        drawCols();
        drawRows();
    }, 20);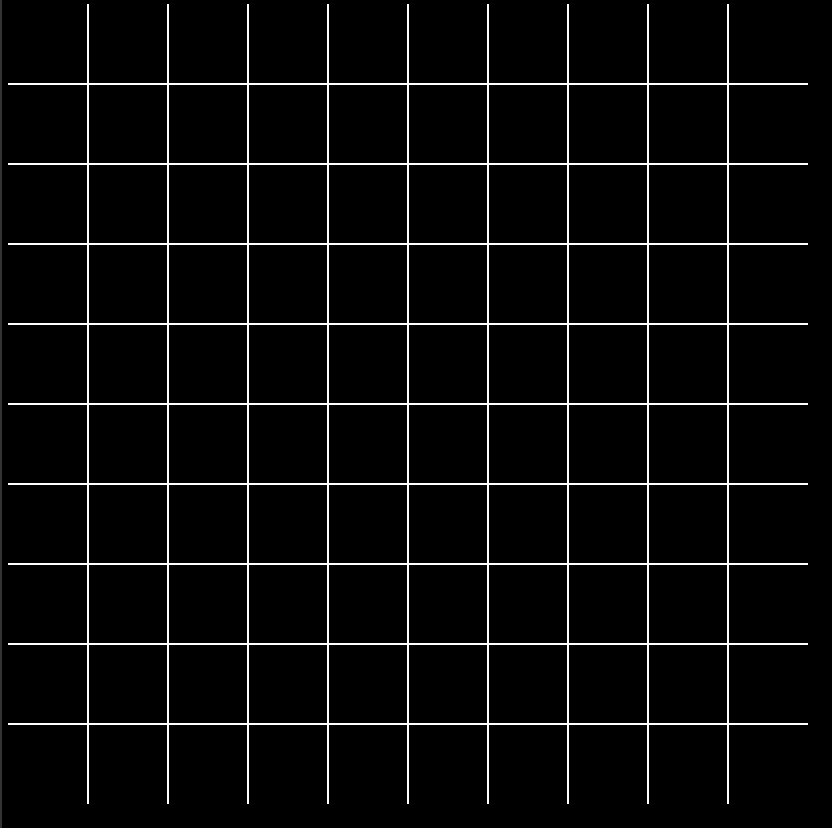
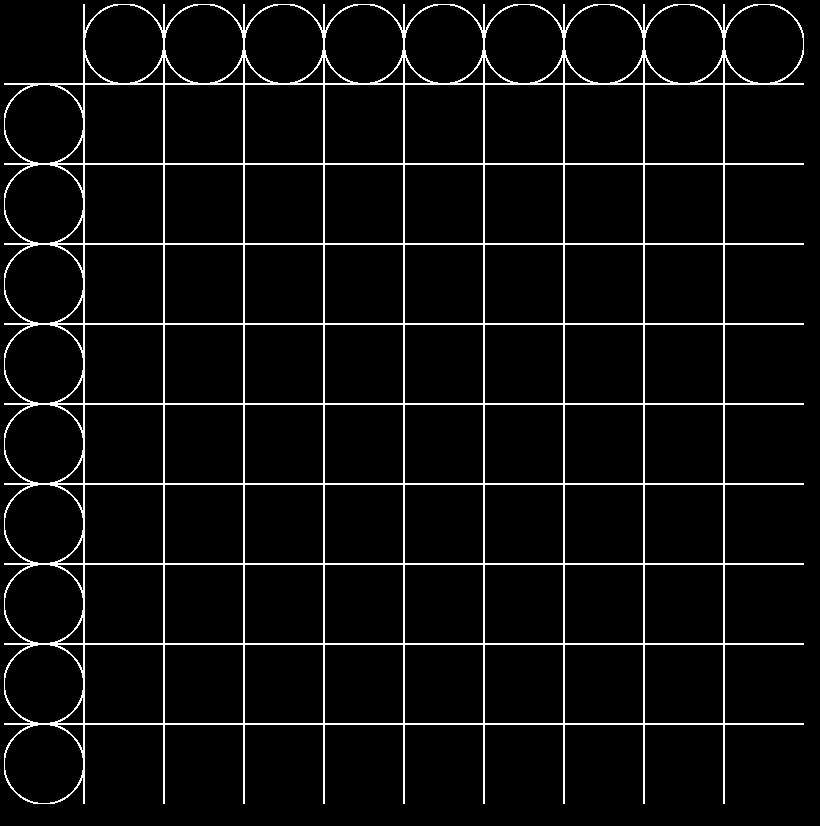
Now I’ll draw the referential ellipses all around the table. So I need a function to draw an ellipse.
    // ...

    function drawEllipse (x, y) {
        ctx.beginPath();
        ctx.arc(x, y, r, 0, 2 * Math.PI, false); // an arc with the center positioned at x, y of radius r, and a length of 2PI.
        ctx.stroke();
    }
I can draw them in the drawCols and drawRows methods.
    // ...

    function drawCols () {
        for (let i=0; i<cols; i++) {
            let cx = diameter+diameter*i;
            let cy = r;

            // the center is the same as the lines I draw, I need to add it's radius to position the ellipse in between.
            drawEllipse(cx+r, cy);

            // ...
        }
    }

    function drawRows () {
        for (let j=0; j<rows; j++) {
            let cx = r ;
            let cy = diameter+diameter*j;

            // same here but vertically.
            drawEllipse(cx, cy+r);

            // ...
        }
    }
Now I want to draw a point that will evolve at different speed in each circle. So I’ll need to update the angle at each iteration, and draw the point
    // ...

    function drawPosition (x, y) {
        ctx.beginPath();
        ctx.arc(x, y, 4, 0, 2 * Math.PI, true); // same as the ellipse, but with a radius of 4.
        ctx.fill();
    }

    function drawCols () {
        for (let i=0; i<cols; i++) {
            let cx = diameter+diameter*i;
            let cy = r;

            drawEllipse(cx+r, cy);

            // we calculate the position according to the angle.
            // to increase the speed of each circle, we multiply by i the angle. (the +1, is for the position 0 ;))
            let x = r * Math.cos(angle * (i+1) - (Math.PI / 2));
            let y = r * Math.sin(angle * (i+1) - (Math.PI / 2));

            drawPosition(cx+x+r, cy+y);

            // ...
        }
    }

    function drawRows () {
        for (let j=0; j<rows; j++) {
            let cx = r ;
            let cy = diameter+diameter*j;

            drawEllipse(cx, cy+r);

            let x = r * Math.cos(angle * (j+1) - (Math.PI / 2));
            let y = r * Math.sin(angle * (j+1) - (Math.PI / 2));

            drawPosition(cx+x, cy+y+r);

            // ...
        }
    }

    setInterval(() => {
        ctx.clearRect(0,0,canvasWidth,canvasHeight);
        drawCols();
        drawRows();

        angle += 0.01; // at each iteration, add .1 of angle.
    }, 20);
Inside we’ll draw the curves. For this I’ll use a class.
    // ...

    class curve {
     //...
    }
We are going to need to keep track to of each point for each curve, and set the position between each iteration.
    // ...

    class curve {
        constructor() {
            this.points = [];
            this.current = {x: 0, y: 0};
        }
    }
Two setters for the position.
    // ...

    class curve {
        //...

        setX (x) { this.current.x = x; }
        setY (y) { this.current.y = y; }
    }
A method to add a new point in the history.
    // ...

    class curve {
     //...

         addPoint () {
             this.points.push(this.current);
             this.current = {x: 0, y: 0};
         }
    }
And to finish we need a method to draw these points.
    // ...

    class curve {
     //...
        drawPoints () {
            for (var i = 1; i < this.points.length-2; i++) {
                ctx.fillRect(this.points[i].x, this.points[i].y, 1, 1);
            }
        }
    }
Let initialize each curve according to the number of columns and rows.
    // ...

    for (let i=0; i<cols; i++) {
        curves[i] = [];
        for (let j=0; j<rows; j++) {
            curves[i][j] = new curve();
        }
    }
Now we need to update the position of the curve between each iteration. The x position has to be updated when drawing the columns and the y position has to be updated when drawing the rows.
    // ...

    function drawCols () {
        // ...

        for (let j=0; j<rows; j++) {
            curves[j][i].setX(cx + x);
        }
    }

    function drawRows () {
        // ...

        for (let i=0; i<cols; i++) {
            curves[j][i].setY(cy + y);
        }
    }
We are almost done. We still need to add these points to the curve in each iteration.
    // ...

    function addPaths () {
        for (let i=0; i<cols; i++) {
            for (let j=0; j<rows; j++) {
                curves[i][j].addPoint(); // for each iteration, add the current point to each curve history
                curves[i][j].drawPoints(); // for each iteration draw the points.
            }
        }
    }

    setInterval(() => {
        // ...

        addPaths();
    }, 33);
Mesmerizing! If We want this to be alright, we need to reset the paths after each revolution. Otherwise we’ll end up with too much points to handle.
    // ...

    class curve {
        // ...

       reset () {
           this.points = [];
       }
    }

    setInterval(() => {
        // ...

        if (angle > Math.PI*2) {
            for (let i=0; i<cols; i++) {
                for (let j=0; j<rows; j++) {
                    curves[i][j].reset()
                }
            }
        }
    }, 33);
Now it’s your turn. Try it. What would be the result if I set the canvas size to 1200x1200 or even larger? Maybe play with colors, superposition, timing… Send me yours :)
The code is available here.
See you until the next one :)